
Description
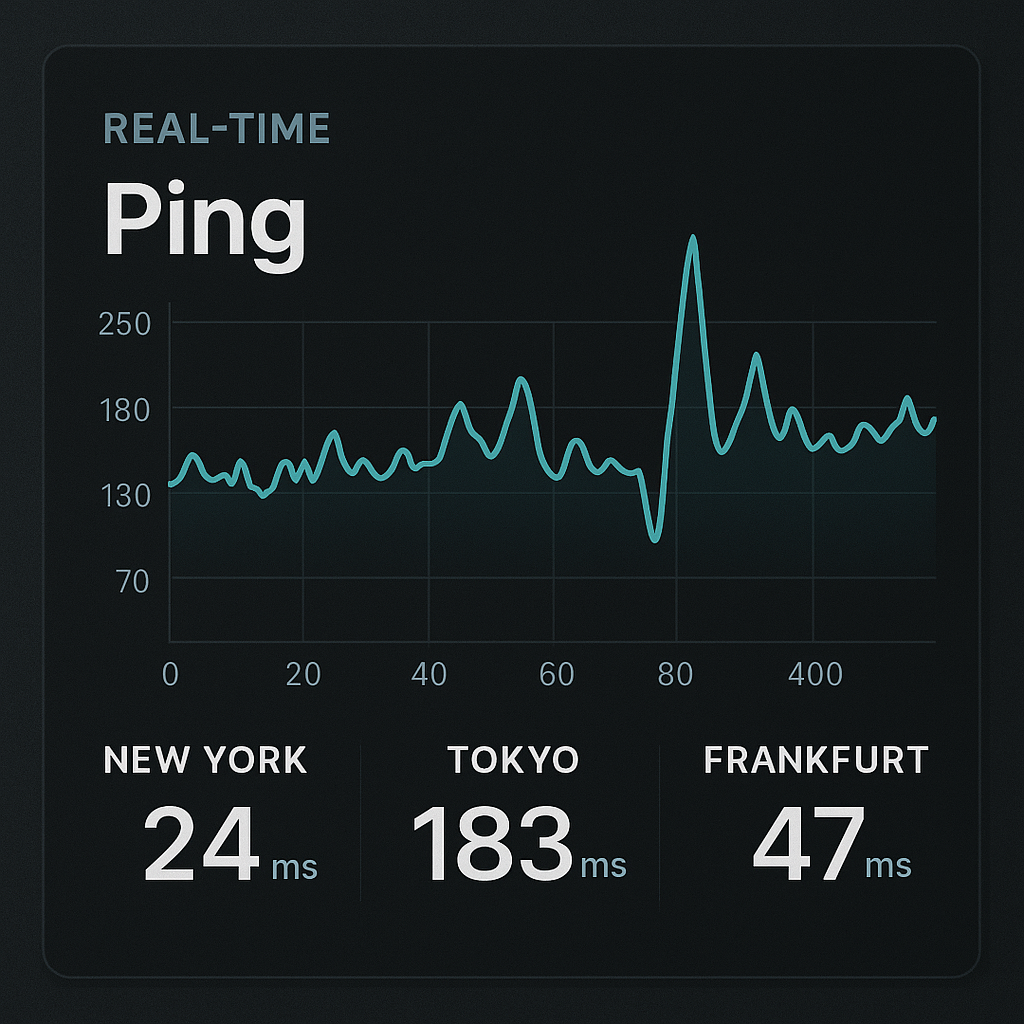
Track uptime, latency, and packet loss across global endpoints in real time. This dynamic monitoring solution includes a Node.js-based backend with Prometheus integration and a sleek HTML dashboard ready to deploy on internal or external NOCs.
Key Features:
-
Latency graphs with alert thresholds and historical retention
-
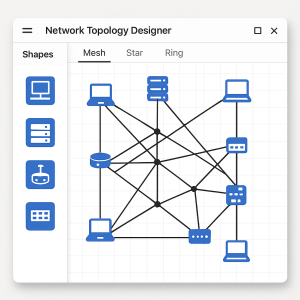
Location tagging: Monitor by city, datacenter, or service type
-
Web-based dashboard with automatic refresh and dark/light mode
-
Integration-ready: Slack alerts, Discord hooks, SNMP traps
-
Export .json, .csv, .pdf reports for quarterly reviews
-
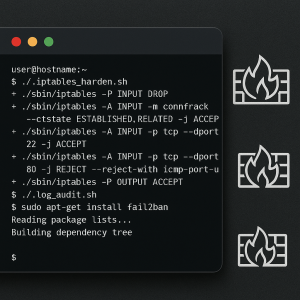
Embedded test ping for troubleshooting edge routing
Ideal For: Global network ops, IT infrastructure leads, SaaS teams.


Reviews
There are no reviews yet.